Amsterdam, Netherlands
Amsterdam on one page: facts, climate by month, daylight and public holidays, each with its source.
- Population: 941,927 (Municipality of Amsterdam, 1 January 2026)
- Warmest month: July, daily high 22.5 °C (72.5 °F), 1991-2020
- Coldest month: February, daily low 1.0 °C (33.8 °F), 1991-2020
- Wettest month: August, rain 98.6 mm (3.88 in), 1991-2020
- Most daylight: June, 16 h 47 min (15th of each month, 2026)
Warmest, coldest, wettest, most daylight: the highest or lowest of the 12 monthly values. Figures in brackets are converted: °F = °C × 9 ÷ 5 + 32, to 1 decimal; inches = mm ÷ 25.4, to 2 decimals.
Last updated : page title reworded; share preview improved.
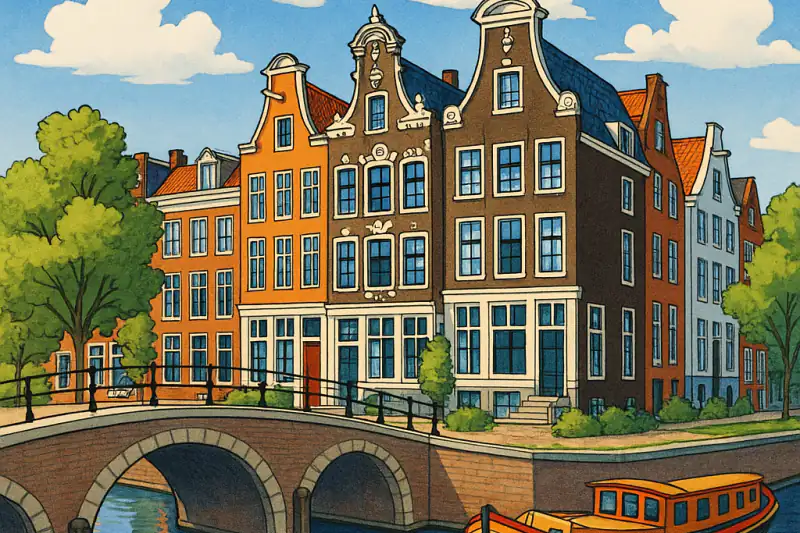
Illustration, AI-generated.
What makes Amsterdam special
- What do locals mean when they call the city Mokum?
- Mokum is a Yiddish word for place. It comes from Hebrew. In Yiddish, a few Dutch and German towns got the name Mokum plus a letter, and Amsterdam got Alef, its A. Today, folks in Amsterdam still use Mokum as a fond pet name for their town. Source: Wikipedia, checked .
- How did Amsterdam get its name?
- A fishing village grew up where the Amstel river met open water. Later, people built a dam with sluices across the river to keep out floods. The village took its name from that dam, and kept it as it grew into a town: Amstel plus dam. Source: United Nations (UNGEGN), checked .
- What are the brown posts along the edge of the pavements?
- Locals call them Amsterdammertjes, which means little ones from Amsterdam. These red-brown steel posts keep cars off the walk. Each one bears the X-shaped crosses of the town crest. The city has been taking lots of them away, since raised walks now do the job. Source: Wikipedia, checked .
- Where do all the lost bikes end up?
- Lots of them end up in the canals. The city pays crews of bike fishers to drag them back out. Officials blame part of it on people who had too much to drink. Many of the old bikes get recycled, even into the metal for drink cans. Source: NPR, checked .
- What holds up the old houses on such soft, wet ground?
- Wooden poles. Builders drove whole tree trunks deep into the boggy ground until they hit a firm layer of sand. Heavy beams and stone went on top. The poles must stay under water so they do not rot. Over time they squeeze down a bit, so some houses sag. Source: Getty Conservation Institute, checked .
- Why do so many people live on boats in the canals?
- Boat homes caught on when homes on land were hard to find, above all after the world wars. Some families even shared a boat. Many people made homes out of old cargo boats, with rooms where the cargo once went. Long ago, traders lived on boats here too. Source: Amsterdam Canal Museum, checked .
Facts
| Fact | Value and source |
|---|---|
| Country | Netherlands Short form. M49 lists "Netherlands (Kingdom of the)". Source: United Nations Statistics Division (M49), checked |
| Population | 941,927 (Municipality of Amsterdam, 1 January 2026) Source: Statistics Netherlands (CBS), checked |
| Area | 188.12 km² (Municipality of Amsterdam, land, 2025) Total with water: 243.65 km². Source: Statistics Netherlands (CBS), checked |
| Coordinates | 52.3667° N, 4.8833° E rounded to four decimal places Source: Wikidata Query Service, checked |
| Time zone | Europe/ |
| Languages | Dutch (official) Source: General Administrative Law Act (Awb), art. 2:6, checked |
| Currency | Euro (EUR) list dated 17 September 2026 Source: ISO 4217 list one (SIX Group), checked |
Climate by month
| Month | High, °C | Low, °C | Rain, mm | Sunshine, hours |
|---|---|---|---|---|
| Jan | 6.2 | 1.2 | 66.5 | 69.0 |
| Feb | 6.9 | 1.0 | 54.7 | 94.3 |
| Mar | 10.1 | 2.8 | 51.8 | 146.0 |
| Apr | 14.3 | 5.2 | 39.6 | 197.7 |
| May | 17.8 | 8.6 | 53.9 | 230.7 |
| Jun | 20.3 | 11.3 | 64.8 | 217.2 |
| Jul | 22.5 | 13.5 | 82.3 | 225.4 |
| Aug | 22.4 | 13.4 | 98.6 | 203.5 |
| Sep | 19.2 | 11.0 | 84.4 | 154.2 |
| Oct | 14.7 | 7.7 | 86.7 | 116.9 |
| Nov | 10.0 | 4.5 | 85.3 | 66.8 |
| Dec | 6.9 | 1.9 | 81.7 | 58.2 |
Climate normals 1991-2020, computed by KNMI and submitted to the World Meteorological Organization. Checked .
High: mean daily maximum temperature. Low: mean daily minimum temperature. Rain: mean monthly precipitation total. Sunshine: mean monthly sunshine duration.
Daylight by month
| Month | Sunrise | Sunset | Day length |
|---|---|---|---|
| Jan | 08:43 | 16:57 | 8 h 14 min |
| Feb | 07:56 | 17:54 | 9 h 57 min |
| Mar | 06:55 | 18:45 | 11 h 50 min |
| Apr | 06:43 | 20:39 | 13 h 56 min |
| May | 05:45 | 21:30 | 15 h 44 min |
| Jun | 05:18 | 22:04 | 16 h 47 min |
| Jul | 05:36 | 21:56 | 16 h 19 min |
| Aug | 06:23 | 21:06 | 14 h 42 min |
| Sep | 07:15 | 19:56 | 12 h 41 min |
| Oct | 08:06 | 18:46 | 10 h 40 min |
| Nov | 08:02 | 16:48 | 8 h 46 min |
| Dec | 08:44 | 16:27 | 7 h 43 min |
Sunrise and sunset computed to the minute. Day length in hours and minutes. How we compute daylight
Source: NOAA Solar Calculator equations, checked .
Airports
| IATA code | Airport | Type | Distance, km |
|---|---|---|---|
| AMS | Amsterdam Airport Schiphol | large airport | 10 |
Source: OurAirports airports.csv, checked .
Public holidays
| Date | Holiday |
|---|---|
| Thursday | New Year’s Day |
| Friday | Good Friday (A working day at most companies) |
| Sunday | Easter Sunday |
| Monday | Easter Monday |
| Monday | King’s Day |
| Tuesday | Liberation Day (Not a day off for everyone) |
| Thursday | Ascension Day |
| Sunday | Whit Sunday |
| Monday | Whit Monday |
| Friday | Christmas Day |
| Saturday | Boxing Day |
| Date | Holiday |
|---|---|
| Friday | New Year’s Day |
| Friday | Good Friday (A working day at most companies) |
| Sunday | Easter Sunday |
| Monday | Easter Monday |
| Tuesday | King’s Day |
| Wednesday | Liberation Day (Not a day off for everyone) |
| Thursday | Ascension Day |
| Sunday | Whit Sunday |
| Monday | Whit Monday |
| Saturday | Christmas Day |
| Sunday | Boxing Day |
Typed from the official list and re-checked, .
Source: Official public holiday list (rijksoverheid.nl), checked .
Landmarks
| Place | Kind | Lasting fact and source |
|---|---|---|
| Dutch Water Defence Lines: Works along the IJ before Durgerdam (Vuurtoreneiland) | World Heritage site | UNESCO entry |
| Seventeenth-Century Canal Ring Area of Amsterdam inside the Singelgracht | World Heritage site | UNESCO entry |
| Rijksmuseum | museum | National monument since 1970, RCE |
| Van Gogh Museum | museum | Opened 1973, own site |
| Royal Palace Amsterdam | historic site or monument | National monument since 1970, RCE |
| Vondelpark | park or garden | National monument since 1996, RCE |
| Westerkerk | place of worship | National monument since 1970, RCE |
| Oude Kerk | place of worship | National monument since 1970, RCE |
Sources: as named in each row, checked between and . Rijksmonumentenregister (RCE): Rijksdienst voor het Cultureel Erfgoed, CC0 1.0 for the data; the pages state none. How we choose landmarks
Other cities
In Netherlands
No other city in Netherlands on this site.
Closest climate
Among the 20 cities with month pages, these have the monthly highs and lows nearest to Amsterdam's, averaged over the year. How we compare climates
Sources
- Wikidata Query Service, Wikimedia Foundation. Attribution: Wikidata. Licence: CC0 1.0. Checked .
- GeoNames dump (cities15000, countryInfo), GeoNames. Attribution: GeoNames, https://www.geonames.org/. Licence: CC BY 4.0. Checked .
- OurAirports airports.csv, OurAirports (David Megginson). Attribution: OurAirports. Licence: Public domain. Checked .
- WMO Climatological Standard Normals for 1991-2020 (NCEI Accession 0253808), WMO Member Nations (each national weather service's own submission); archived by NOAA National Centers for Environmental Information. Attribution: WMO Member Nations (2023). WMO Climatological Standard Normals for 1991-2020 (NCEI Accession 0253808). Station files named in each record. NOAA National Centers for Environmental Information. Dataset. https://doi.org/10.25921/800j-vn07. Accessed on the check date shown. Licence: No licence stated. Published by NOAA NCEI for WMO; citation requested. Checked .
- NOAA Solar Calculator equations, computed locally, NOAA Global Monitoring Laboratory (method); City by Month (computation). Attribution: Computed with the NOAA Solar Calculator method (no NOAA endorsement implied). Licence: Method, not data. Checked .
- IANA Time Zone Database, read through the PyPI tzdata package, IANA. Attribution: IANA Time Zone Database. Licence: Public-domain data. Checked .
Official sources
- General Administrative Law Act (Awb), art. 2:6. Checked .
- ISO 4217 list one (SIX Group). Checked .
- Official public holiday list (rijksoverheid.nl). Checked .
- Statistics Netherlands (CBS). Checked .
- United Nations Statistics Division (M49). Checked .
Cite this page: City by Month. "Amsterdam climate by month and facts". https://citybymonth.com/cities/netherlands/amsterdam/. Last updated 8 November 2026.